“Cookbook” blog series – a collection of best practices for solving problems. Each blog in this series is a result from our experiences, customer projects and gained knowledge through the web community.
Problem
You want to optimize your Java memory. For example an OutOfMemoryError can occur in several parts of Java’s Runtime Data Area: in the young or old generation of the heap space, permanent generation or code cache of the non-heap area.
Solution
The following steps are required to optimize your memory in the Java application:
- Analyze the memory usage of the running application
- Adjust the JVM arguments
Memory Usage
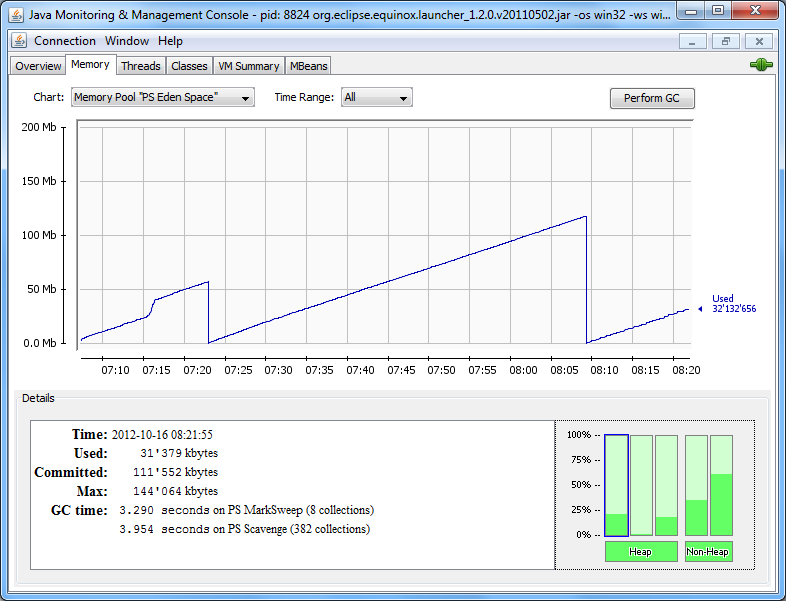
The JConsole is a tool for monitoring performance and resource consumptions of applications running under Java. In the tool you can get a good overview of the running JVM process in the “VM Summary” tab containing: VM arguments, JVM version, number of threads and loaded classes, heap size, class path, etc.
In the “Memory” tab you can see in a timeline for each memory pool in the heap / non-heap space the memory usage:
A more detailed memory analysis in the heap can be done based on a heap dump. A heap dump can either be forced by an OutOfMemoryError or manually created by the following:
-XX:+HeapDumpOnOutOfMemoryErrorand-XX:HeapDumpPathjmap -dump:live,format=b,file=
An interesting option is -XX:OnOutOfMemoryError allowing to execute a script like a shutdown command or notification email.
JVM arguments
For a better understanding of Java’s runtime data area read this blog of the “Under the Hood” series. In short the runtime data area consists of these three parts: heap space, method and native area.
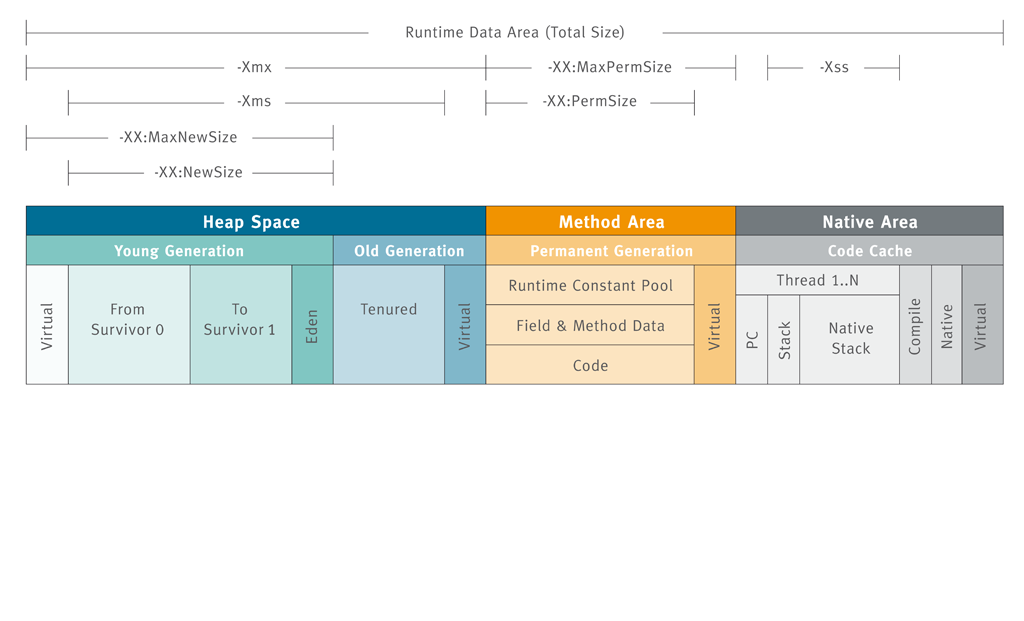
In each memory part of the runtime data area several options can be set. The options mostly used are initial and max memory settings like for the heap space, permanent and young generation.
These options set the following memory areas:
| -Xmx | Max heap size |
|---|---|
| -Xms | Initial heap size |
| -XX:MaxNewSize | Max young generation size |
| -XX:NewSize | Initial young generation size |
| -XX:MaxPermSize | Max permanent generation size |
| -XX:PermSize | Initial permanent generation size |
| -Xss | Thread’s stack size |
Especially the last option regarding the stack size is worth mentioning. The default value is 0 and lets the OS define the thread size (512k under a 32-bit JRE). Depending on the application a smaller size like 256k might be enough and reduces the memory foot print the native area.
I ran into another interesting blog finding out how to display all “-XX” arguments and its values.
Since Java 6 Update 23 there is the option java -XX:+PrintFlagsFinal. The console result is then:
java -XX:+PrintFlagsFinal
[Global flags]
...
    uintx MaxNewSize                                = 4294901760      {product}
...
    uintx MaxPermSize                               = 85983232        {pd product}
...
    uintx MinHeapFreeRatio                          = 40              {product}
...
     intx NewRatio                                  = 2               {product}
    uintx NewSize                                   = 1310720         {product}
...
For each line the following columns are displayed:
- Data type: intx (integers), uintx (unsigned integers), bool, etc.
- Argument Name: like NewSize, MaxHeapSize, etc.
- Assignment: where “=” means it has the default value and “:=” for another value set by a command line or by the HotSpot.
- Value
- Category: like product, manageable, diagnostic, etc. C1 relates to the client JVM and C2 to the server JVM.
Discussion
Using JConsole, heap dumps and other monitoring tools help you identifying the required memory and possible memory leaks. The above mentioned arguments allows you to tweak your memory spaces in the JVM. There is much more you can do and I will cover in another blog. In the meanwhile you may find these links interesting:
Garbage Collection, Part 2 – Mark and Sweep Algorithms
Runtime Data Areas – Java’s Memory Model
Useful JVM Flags – Part 3 (Printing all XX Flags and their Values)