“Under the Hood” blog series – getting a deeper technical insight like the mobile solutions, JVM, computer languages, scripts, databases and other interesting tools and technologies. Each blog in this series is a result from our experiences, customer projects and gained knowledge through the web community.
Every developer gets once confronted by Java memory questions like: What size should I define for the Heap space? An OutOfMemoryError covers which part of the runtime data area? In the Heap, PermGen, or Thread? And how do I solve it?
Java Memory Model
The Java memory model is specified in the latest JVM specification, Java SE 7 Edition, and mainly in the chapters “2.5 Runtime Data Areas” and “2.6 Frames”. In a nutshell primitive, object and class data are stored in 3 different memory areas: heap space, method area and native are.
The heap space holds object data, the method area holds class code, and the native area holds references to the code and object data.

The method area is also known as the permanent generation space (PermGen). All class data are loaded into this memory space. This includes the field and method data and the code for the methods and constructors.
[UPDATE]
Oracle has planned in JDK 7 to completely remove the PermGen space from the JVM. Reason is the consolidation of HotSpot and JRockit. As a result the method area will be part of the operating system’s native heap.
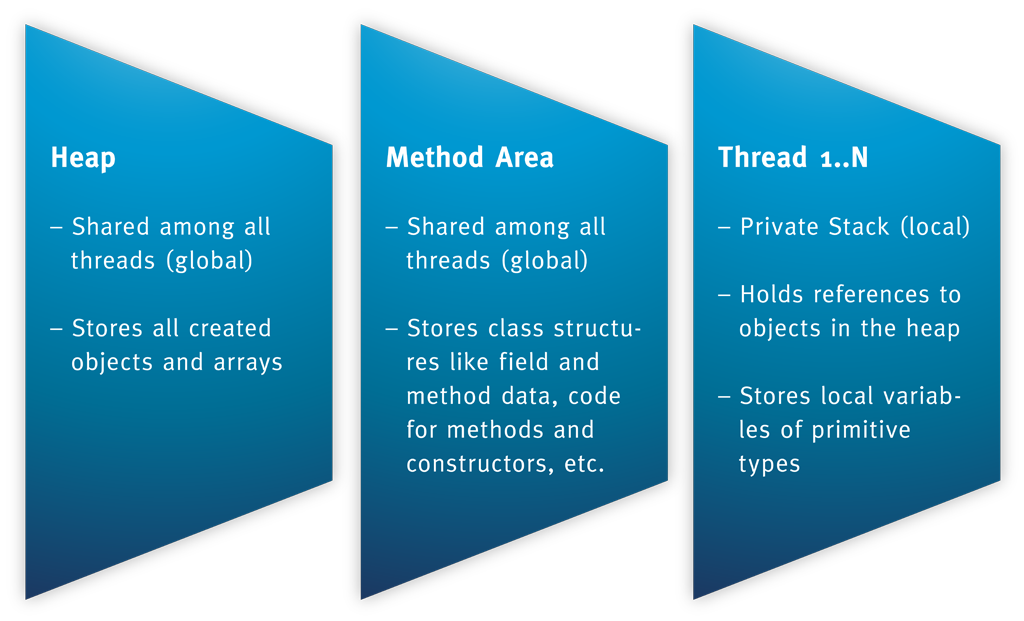
All objects being instantiated during runtime are stored in the heap space. The heap space again is divided into several parts: eden, survivor, and old generation Space.
Method executions are within a thread. Local variables of primitive types and references are stored here. The references for example points to Objects like String stored in the Heap space. Here is a video demonstrating the interaction between a stack and the heap.
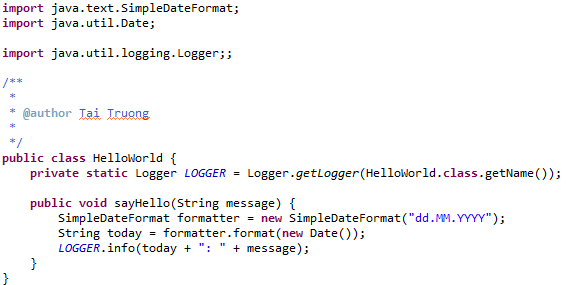
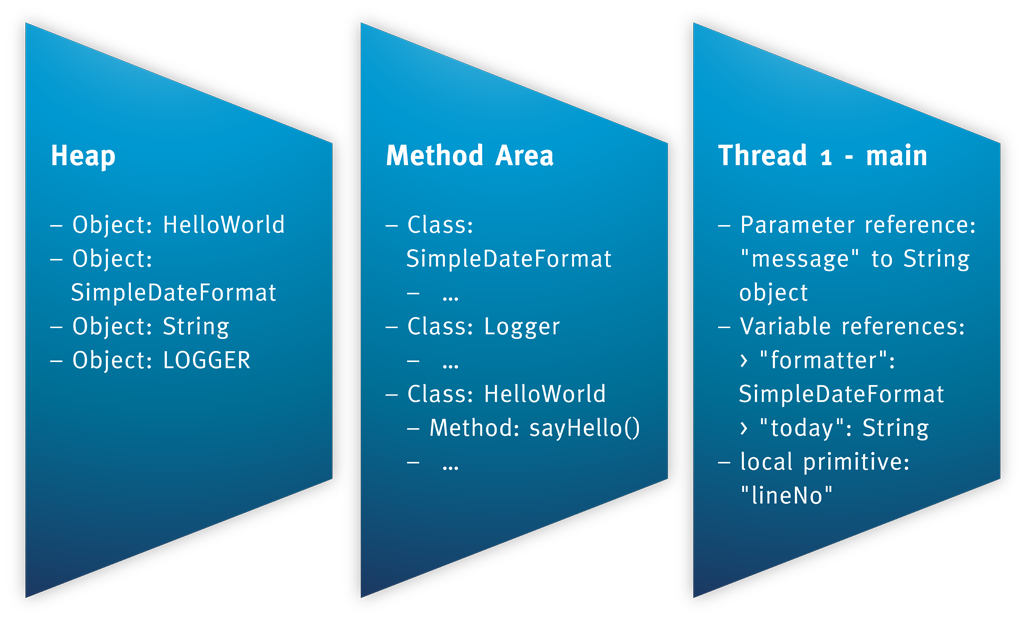
For a better understanding let’s have a look at another example code:
The data are then stored like this:
With the JConsole tool it is possible to view the memory allocations in the heap, the number of threads and loaded classes of a running Java application (e.g. Eclipse):
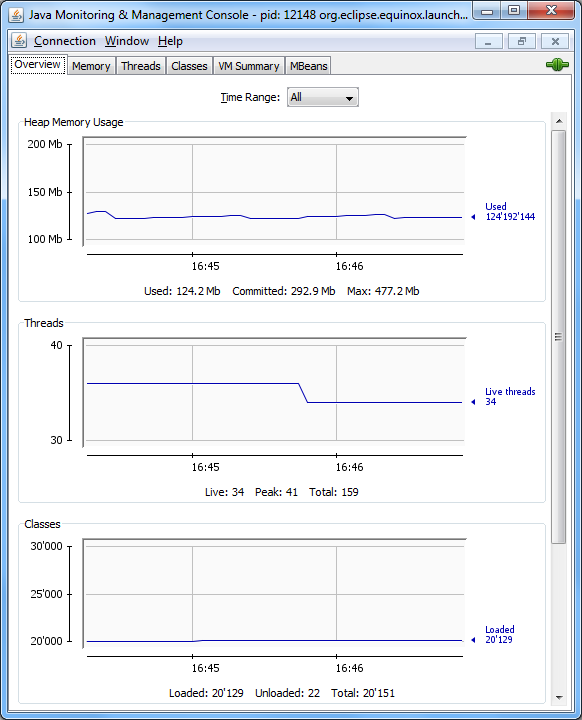
Read here to get more details about the JConsole
Java Memory Architecture
There is an excellent white paper about Memory Management in the Java
HotSpot™ Virtual Machine. It describes about the automatic memory management handle using garbage collection.
The Java memory architecture consists of the following parts:
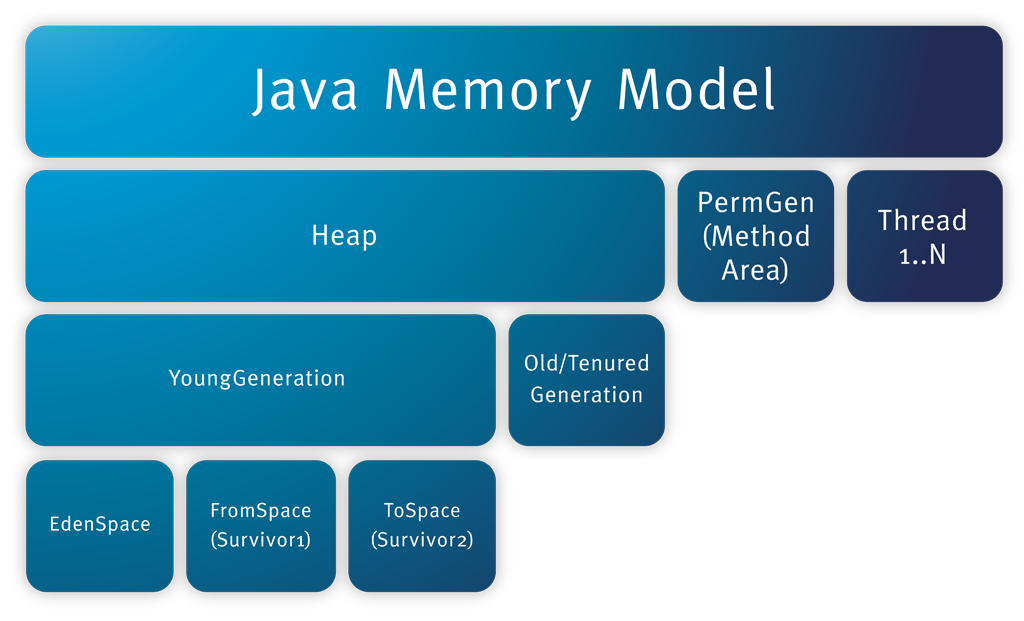
Heap memory
Since objects are stored in the heap part it is worth to have a closer look. The heap space itself is again separated into several spaces:
- Young generation with eden and survivor space
- Old Generation with tenured space
Each space harbors objects with different life cycles:
- New/short-term objects are instantiated in the eden space.
- Survived/mid-term objects are copied from the eden space to the survivor space.
- Tenured/long-term objects are copied from the survivor to the old generation space.
By separating objects by their life time allows a shorter time consumption of the minor garbage collection and in return there is more cpu time for the application.
The reason is that in Java – unlike C – memory is freed (by destroying objects) automatically by two different garbage collectors: a minor and major garbage collection.
Instead of validating all objects in the heap – whether it can be destroyed or not – the minor garbage collector marks undestroyed objects with a garbage count. After a certain count the object is move to the old generation space.
A more detailed blog of the garbage collection will be discussed in another blog. For now it is sufficient to know that there are two garbage collectors.
OutOfMemoryError – but where?
Having this memory architecture in mind also helps to understand the different OutOfMemoryErrors like:
- Exception in thread “main”: java.lang.OutOfMemoryError: Java heap space
Reason: an object could not be allocated into the heap space. - Exception in thread “main”: java.lang.OutOfMemoryError: PermGen space
Reason: classes and methods could not be loaded into the PermGen space. This occurs when an application requires a lot of classes e.g. in various 3rd party libraries. - Exception in thread “main”: java.lang.OutOfMemoryError: Requested array size exceeds VM limit
Reason: this occurs when an arrays is created larger than the heap size. - Exception in thread “main”: java.lang.OutOfMemoryError: request bytes for . Out of swap space?
Reason: this occurs when an allocation from the native heap failed and might be close to its limit. The indicates the source of the module where this error occurs. - Exception in thread “main”: java.lang.OutOfMemoryError: (Native method)
Reason: this error indicates that the problem originates from a native call rather than in the JVM.
For more details on OutOfMemoryError you can read “Troubleshooting Guide for HotSpot VM”, Chapter 3 on “Troubleshooting on memory leaks”.
Outlook
In another part of this series we will have dive deeper into the memory model and how the garbage collections are working. This blog series aim to cover the concepts of Java. A more practical approach is the Cookbook series. In the first cookbook I will cover JVM arguments for memory tuning in the runtime data area.
Useful Links
Provides Java HotSpot information about VM Options and environment variables
Troubleshooting Guide for HotSpot VM
An exhaustive guide for memory leaks, system crashes, hangings, loops, signal and exception handling.
Java SE 6 HotSpot[tm] Virtual Machine Garbage Collection Tuning
Ergonomics and tuning goals, generations sizing using VM arguments.
Thanks for the memory – Understanding how the JVM uses native memory on Windows and Linux
Explains how the memory in the JVM like the heap is memory into the RAM on different operating systems and CPUs (32/64bit).
Java Micro Edition – Tuning
Describes runtime options to adjust performance in the Java ME edition. It also illustrates the compilation of bytecode into native code.
Summary of Sun’s document “Tuning Garbage collection with the 1.4.2 Hotspot JVM”.
Discussion about where references and objects are stored in the JVM.
