“Under the Hood” blog series – getting a deeper technical insight like the mobile solutions, JVM, computer languages, scripts, databases and other interesting tools and technologies. Each blog in this series is a result from our experiences, customer projects and gained knowledge through the web community.
Java’s memory model in the runtime data area is separated into three different parts: the heap, method area and native area. It is managed by several garbage collectors. In this blog I will explain about objects with different life cycles, its effects during creation until termination (garbage collection), and the necessity of having different ergonomics and garbage collections.
Runtime Data Area – Recap
In the runtime data area we have:
- The heap space: where all objects are created in the young and old generation,
- The method area (PermGen): where basically the Java code based on classes and methods are loaded into the memory, and
- The native area: where the thread stacks are located with references pointing to the code and objects.
In general you can say, “In each thread stack the program is executed referring to the Java logic in the method area and the object data in the heap space”.
For more details refer to my other blog about Java’s memory model.
NOTE: To be precise you need to know that in each stack there are frames. The program logic and execution order is represented by these frames (like a method is calling another method and each method is stored in its frame). For understanding the garbage collection we simply refer to the stack when talking about references and method calls.
Object Life Cycle
Let us have a look at an example code:
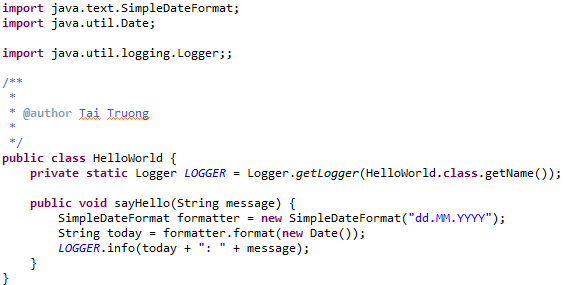
As you can see the following objects are created:
- LOGGER: class variable referring to a Logger object,
- formatter: a local variable referring to a SimpleDateFormat object,
- today: a local variable referring to a String object
- “date”: an unspecified local variable to a Date object, and
- “string”: an unspecified local variable to a String object concatenated with the objects today, message and an additional “: “ String object
All these objects have different scopes:
- Local variables (like “today”) are used within methods,
- Instance variables are used beyond methods depending on its declaration (e.g. private, protected etc.), and
- Class variables (like “LOGGER”) are used beyond methods depending on its declaration.
Unlike local objects where their life cycle ends by the end of a method, all other objects have a longer life cycle. Here is a life time diagram of a typical Java application:
Source: The blue area in the diagram is a typical distribution for the lifetimes of objects. The X axis is object lifetimes measured in bytes allocated. The byte count on the Y axis is the total bytes in objects with the corresponding lifetime. The sharp peak at the left represents objects that can be reclaimed (i.e., have “died”) shortly after being allocated. Iterator objects, for example, are often alive for the duration of a single loop.
But how does a garbage collector defines a short-term or long-term life cycle of an object? Quite simple: it uses a counter as a garbage life cycle for an object and increments it by each garbage iteration that keeps alive. After a garbage life cycle has been reached these objects are moved from the young to the old generation.
In the young generation there is the minor and in the old generation there is the major garbage collector responsible for the life cycle management.
The minor garbage collector does the following:
- New Objects are created into the eden space of the young generation.
Exceptions: Objects like a huge array bigger than the eden space are immediately created in the old generation. - A reference in the stack is created pointing to the object in the young or old generation of the heap space.
Garbage Collection Concepts
Here is a summary of memory management white paper, chapter 3:
A garbage collector respectively memory management is responsible for:
- allocating memory,
- ensuring that referenced objects remain in memory, and
- mark unreferenced objects as free memory.
Objects can be reference by other objects in the young generation or old generation in the heap. References can also be originated from the PermGen space or in a frame of a thread stack in the native area. In most cases the root reference originates from a stack.
On the one hand Garbage collection automates the management of memory and as a Java developer we do not have to deal with it. On the other hand it cannot solve all problems and it is in our responsibility to detect and solve memory leaks.
Another challenge of garbage collection is the fragmentation of free memory. But more about that please read further.
Design Choices
In Java we can define which garbage collector should be used. For that we need to consider the design choices being made on the different collectors:
- Serial vs. parallel
Depending on the number of CPUs or cores the garbage collection algorithm can be split into several parts.
The advantage of faster processing goes on the expensive of complexity and possible fragmentation. - Concurrent vs. Stop-the-World
Where concurrent garbage collection goes hand in hand with the application execution the stop-the-world does not. It stops (pauses) the application and during that time the JVM is exclusively busy with garbage collection.
The advantage of stop-the-world collection is its simple processing, due to unchanged objects in the heap. On the other hand concurrent collection is faster but it must pay attention to updated and new created objects. - Compacting vs. Non-Compacting vs. Copying
This addresses to fragmentation problem of freed memory after each collection. Fragmented memory increases the possibility of an OutOfMemoryError. Like a large object is created and there is not enough memory in one block, though in total there is enough space in the heap.A non-compacting collector does not care about fragmentation due to faster processing.A compacting collector moves objects together. In this case it takes longer than the non-compacting collector but instead we can use the total free memory in the heap.Another way of defragging memory is to copy a fragmented memory space (like eden space) to an unfragmented memory space (like survivor space). More about that in my next blog about Mark and Sweep Algorithms.
Performance Metrics
There are several performance metrics to be considered when considering garbage collection:
- Throughput
The total time (in percentage) available for the application and not for the garbage collection.
The goal here is to have a maximum throughput between 95 and 99%. - Garbage collection overhead
The total time (in percentage) – also known as pause time – spent for the garbage collection and not for the application.
The goal here is to have a minimum collection overhead between 1 and 5%. - Pause time
The time spent for a garbage collection and not for the application (=pause).
The goal here is to have a upper pause limit like 0.5 seconds for the garbage collection not to be excel. - Frequency of (garbage) collection
The number of collection occurrences relatively to application execution.
The goal here is to have a max collection like 2 collections per minute in the young generation. - Footprint
The measure of memory size used by the application.
The goal is to have a low footprint like in the heap space. - Promptness
The time between an object becomes garbage (without a reference) and when it gets available as free memory (garbage collected).
The goal here is to have a fast promptness expressed in higher frequencies of collections or pause time.
For defining the performance goals you can get some garbage output from the application. The following JVM arguments are useful:
Option “-verbose:gc”
Prints information about the heap and garbage collection after each collection. Example:
[GC 57744K->23876K(114432K), 0.0205366 secs]
[GC 102212K->34998K(117376K), 0.0302829 secs]
[Full GC 61441K->61283K(229888K), 0.2891418 secs]
The first two lines indicates a minor garbage collection, and the latter a major (full) garbage collection. It shows the size of the combined life objects before (e.g. 57’744kb) and after (e.g. 23’876kb). As stated in the tuning guide: “After minor collections the size includes some objects that are garbage (no longer alive) but that cannot be reclaimed. These objects are either contained in the tenured generation, or referenced from the tenured or permanent generations”.
The size in brackets (e.g. 114’432kb) is the committed size of the heap for the objects excluding one of the survivor spaces.
The last part is the duration of the minor collection. In this case 0.205366 and 0.0302829 seconds. In the last line you can see the figures for the major collection. As you can see it takes about the same time but it was able not to free as much memory in the tenured generation as for the minor collection in the young generation.
Option “-XX:+PrintGCDetails”
Prints more information details about the heap and garbage collection after each collection. Example:
[GC [PSYoungGen: 56771K->7934K(66560K)] 96247K->48168K(114880K), 0.0128373 secs] [Times: user=0.06 sys=0.00, real=0.01 secs]
[GC [PSYoungGen: 66558K->9322K(67968K)] 106792K->58968K(117632K), 0.0246690 secs] [Times: user=0.06 sys=0.00, real=0.03 secs]
[Full GC [PSYoungGen: 9322K->9272K(67968K)] [PSOldGen: 49646K->49663K(83264K)] 58968K->58936K(151232K) [PSPermGen: 91423K->91423K(140096K)], 0.2685523 secs] [Times: user=0.26 sys=0.00, real=0.27 secs]
In the first and second line the first set of numbers indicates the parallel scavenge of the young generation (PSYoungGen). The seconde set of numbers represents the entire heap.
The third line is a full garbage collection with information about the young and old generation in the heap and also the the permanent generation.
Generational Garbage Collection
In the Java HotSpot JVM the heap is separated into two pools: the young and old generation. In the first pool there are new and short-term objects where in the old (tenured) generation there are older objects. This is based on the following observations being made:
- Most objects live for a short period.
- Only few old objects have references to young objects.
In the HotSpot JVM all objects are initially created in the young generation. After a while the objects are promoted into the old generation:

Source: “Memory Management in the Java HotSpot Virtual Machine” White Paper, Figure 1, page 6
As a result this means for the number of garbage collection calls:
- Young generational collection is performed frequently.
- Old generational collection is performed less or in-frequently.
For the collection strategies this means:
- Young generational collection is focused more on speed efficiency.
- Old generational collection is focused more on memory efficiency.
It is worth mentioning that garbage collection in the old generation takes more time due to the fact it needs to take up most of the heap because:
- The old generation is typically bigger than the young generation, and
- Some objects there refer to young objects possible to be garbage collected.
Outlook
In my next blog I will write about how the different garbage collections work. The HotSpot JVM uses the Mark-and-Sweep algorithm. Based on the generation there are variants of this algorithm. Like Mark-and-Copy for the young and Mark-and-Compact for the old generation.
Useful Links
Garbage Collection, Part 2 – Mark and Sweep Algorithms
“Memory Management in the Java HotSpot Virtual Machine” White Paper
“Java SE 6 HotSpot[tm] Virtual Machine Garbage Collection Tuning”.
Angelika Langer’s great article about “Generational Garbage Collection” (German).